In an era where “data is the new oil,” statistics is the refinery. Whether you are a student, a budding data scientist, or a business professional, understanding the core pillars of statistics is no longer optional—it is a superpower.
This guide strips away the intimidating jargon and breaks down statistics fundamentals into actionable insights. We will move from basic descriptions to the complex world of inference, providing you with the “why” behind the “how.”
1. What is Statistics? (And Why You Should Care)
At its heart, statistics is the science of learning from data. It involves collecting, analyzing, interpreting, and presenting information to make informed decisions under uncertainty.
Statistics is generally divided into two main branches:
- Descriptive Statistics: Summarizing and describing the features of a specific dataset.
- Inferential Statistics: Using a sample of data to make “educated guesses” or predictions about a larger population.

Why EEAT Matters in Statistics Fundamentals
To truly demonstrate Expertise and Trustworthiness in your data analysis, you must understand that statistics isn’t just about math—it’s about context. A “statistically significant” result in a lab might be meaningless in the real world if the sample size was too small or biased.
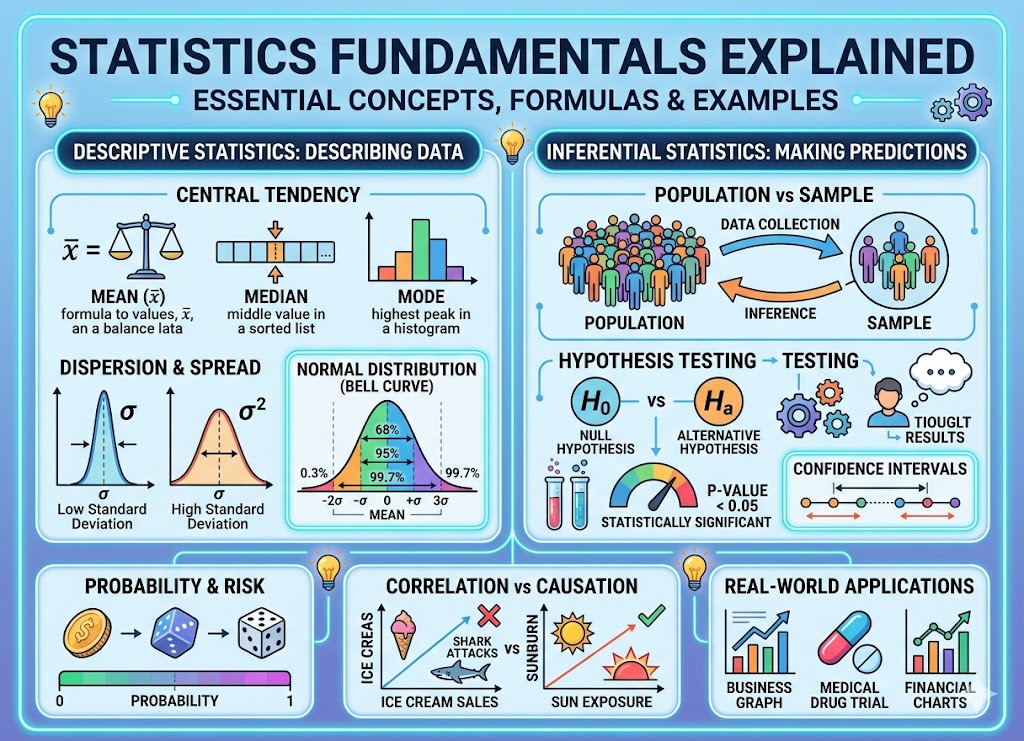
2. Descriptive Statistics: The “Snapshot” of Your Data
Before you can predict the future, you must understand the present. Descriptive statistics help us see the “shape” of our data through three main lenses: Central Tendency, Dispersion, and Distribution.
A. Measures of Central Tendency
These tell us where the “middle” of the data lies.
- Mean (Average): The sum of all values divided by the number of values.
- Formula:

- Formula:
- Median: The middle value when data is sorted. It is “robust,” meaning it isn’t easily swayed by extreme outliers (like a billionaire entering a room of middle-class workers).
- Mode: The value that appears most frequently.
B. Measures of Dispersion (The “Spread”)
Central tendency isn’t enough. If two cities have an average temperature of 75°F (24°C), but one stays between 70-80°F while the other swings between 30-120°F, they are very different places.
- Range: The difference between the highest and lowest values.
- Variance (σ²) : The average of the squared differences from the Mean.
- Standard Deviation (σ): The square root of variance. It tells you, on average, how far each point lies from the mean. A low standard deviation means the data is clustered tightly; a high one means it’s spread out.
3. The Foundation of Probability
Probability is the “language” of statistics. It measures the likelihood of an event occurring, ranging from 0 (impossible) to 1 (certain).
Key Terms:
- Independent Events: The outcome of one doesn’t affect the other (e.g., flipping a coin twice).
- Dependent Events: The outcome of one does affect the other (e.g., drawing a card and not replacing it).
- The Law of Large Numbers: As you perform an experiment more times, the average of the results will get closer to the expected value. (This is why casinos always win in the long run!).
4. Understanding Distributions & The Normal Curve
Data rarely looks like a flat line. Usually, it follows a pattern. The most famous is the Normal Distribution (or Bell Curve).
In a perfectly normal distribution:
- The Mean, Median, and Mode are all equal.
- The curve is symmetrical.
- The Empirical Rule (68-95-99.7 Rule) applies:
- 68% of data falls within 1 standard deviation (1σ) of the mean.
- 95% falls within 2 standard deviations (2σ).
- 99.7% falls within 3 standard deviations (3σ).

5. Inferential Statistics: Making the Leap
This is where the magic happens. We take a Sample (a small group) and use it to draw conclusions about a Population (the whole group).
A. Hypothesis Testing
This is a formal process for investigating ideas.
- Null Hypothesis : The “Status Quo.” It assumes there is no effect or no difference.
- Alternative Hypothesis : What you are trying to prove.
B. The P-Value: The Gatekeeper of Truth
The p-value is the probability that your results happened by pure random chance.
- If p < 0.05: The result is “Statistically Significant.” You reject the Null Hypothesis.
- If p > 0.05: The result could be a fluke. You “fail to reject” the Null Hypothesis.
Expert Tip: Statistical significance does not equal practical importance. Always ask: “Even if this difference is real, is it large enough to matter?”
6. Correlation vs. Causation
One of the most dangerous mistakes in data analysis is assuming that because two things happen together, one caused the other.
- Correlation: A relationship between two variables. (e.g., Ice cream sales and shark attacks both go up in summer).
- Causation: One variable directly influences the other. (Heat causes people to buy ice cream AND go swimming, which leads to shark encounters).
7. Real-World Applications of Statistics
Statistics isn’t just for textbooks; it runs the modern world.
| Field | How Statistics is Used |
| Business | A/B testing two different website designs to see which gets more clicks. |
| Medicine | Clinical trials to determine if a new drug is safer than a placebo. |
| Finance | Using historical data to predict stock market volatility (Risk Management). |
| E-commerce | Recommendation engines (like Amazon or Netflix) predicting what you’ll buy next. |
8. Summary Checklist for Statistics Fundamentals
To master the basics, ensure you can confidently explain:
- [ ] The difference between Sample and Population.
- [ ] Why the Median is better than the Mean for skewed data.
- [ ] What Standard Deviation says about data consistency.
- [ ] How to interpret a p-value of 0.03.
- [ ] The difference between Correlation and Causation.
Frequently Asked Questions (FAQ)
A parameter describes a whole population (e.g., the average height of every human), while a statistic describes a sample (e.g., the average height of 100 people we measured).
Squaring ensures that negative differences don’t cancel out positive ones. It also gives more “weight” to outliers, making them easier to spot.
While 0.05 is the traditional cutoff in many sciences, fields like Physics often require much stricter p-values (like 0.0000003) to claim a discovery.
Conclusion
Statistics is the art of turning noise into signal. By mastering Statistics fundamentals—from the mean and median to hypothesis testing—you gain the ability to look at the world objectively. Don’t let the formulas intimidate you; they are simply tools to help you tell a more accurate story about the data.
Ready to dive deeper? Start by applying these concepts to a small dataset of your own, such as your monthly expenses or your fitness tracking data!
How comfortable do you feel with the math side of these concepts—would you like to walk through a practice calculation for Standard Deviation?