If qualitative data tells you why, quantitative data tells you how many, how much, and how often. That’s a powerful distinction when you need to measure the scale of a problem, test a hypothesis, compare groups, or make a decision that needs to hold up under scrutiny — quantitative data is your foundation. It produces numbers you can analyze statistically, generalize to larger populations, and defend in a boardroom, a journal, or a funding review.
But here’s the problem most guides create: they list four or five methods, define each in two sentences, and leave you no better equipped than when you started. They never tell you how to choose, what can go wrong, or what the numbers actually need to look like before they mean anything.
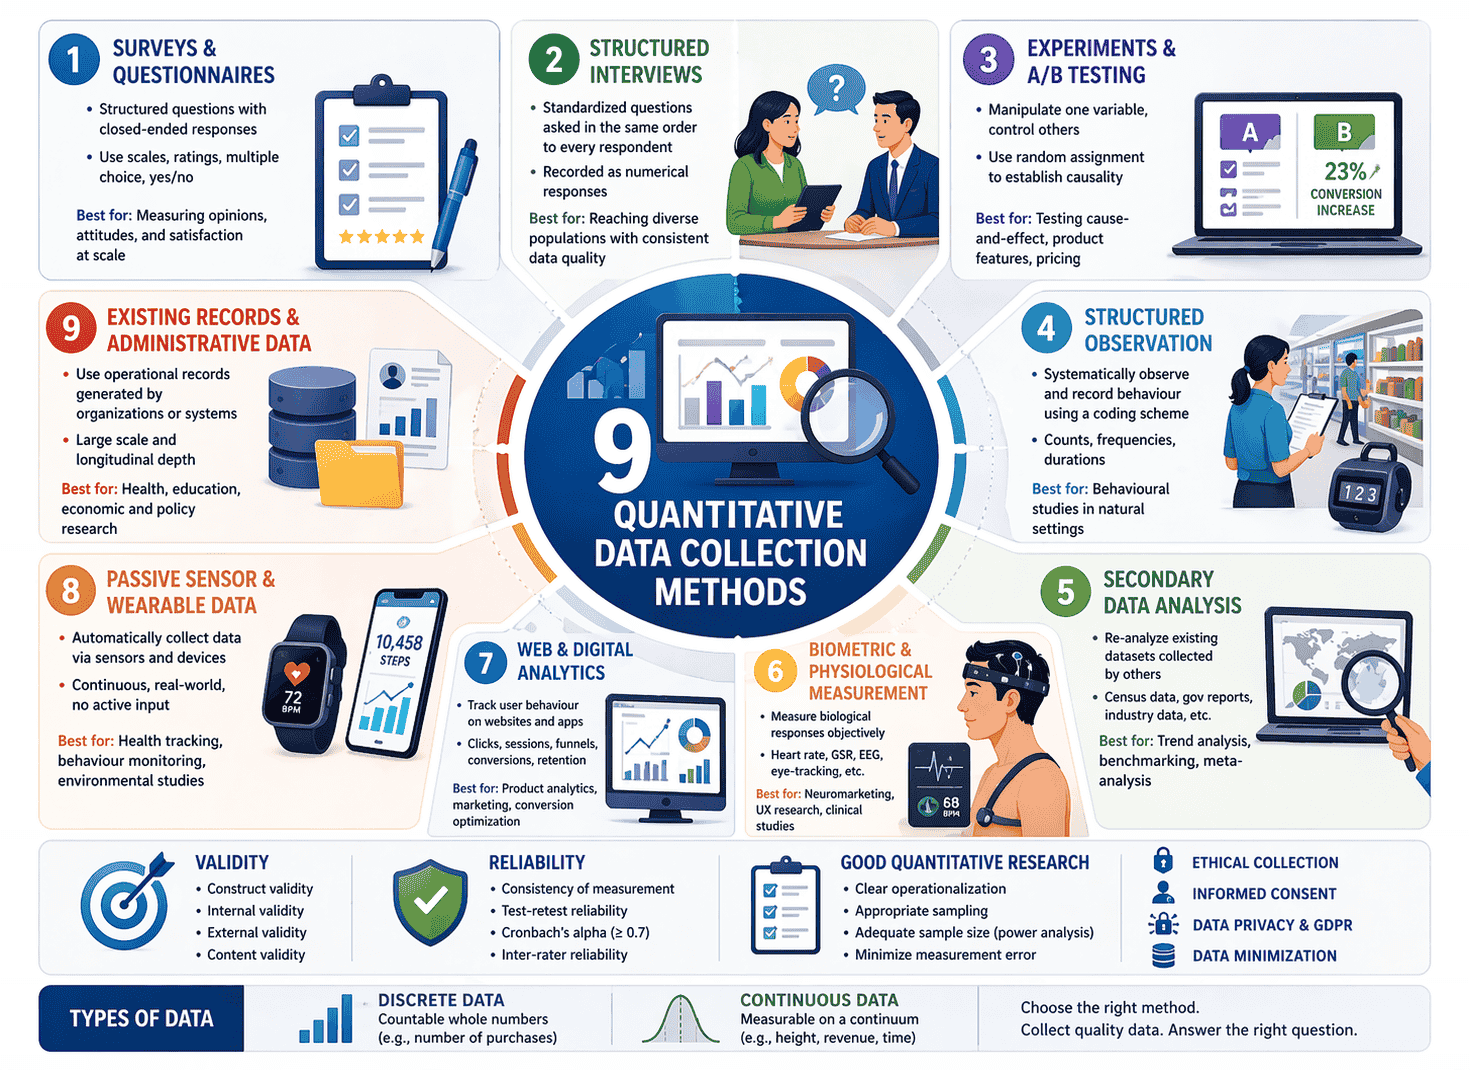
This guide covers all 9 quantitative data collection methods — including modern techniques most articles ignore completely — plus the reliability and validity framework every researcher needs, the measurement traps that quietly destroy data quality, and a practical decision framework to match method to purpose.
What Makes Data “Quantitative”?
Quantitative data is numerical. It answers questions like: How many customers churned this quarter? What percentage of patients responded to treatment? Is Version A significantly better than Version B?
Unlike qualitative data, which captures meaning and experience, quantitative data captures measurement. It uses structured instruments — surveys with rating scales, sensors, counters, structured observation checklists — to produce numbers that can be statistically analysed, visualised in charts, and compared across time, populations, or conditions.
Two fundamental data types sit at the core of quantitative research:
Discrete data — whole numbers that can’t be subdivided. Number of employees, number of purchases, number of survey responses. You can have 3 customers or 4. Not 3.7.
Continuous data — values that exist on a spectrum and can be measured with increasing precision. Height, revenue, temperature, response time. These can be refined to any number of decimal places.
Understanding which type you’re working with matters — because it determines which statistical tests are appropriate and which collection instruments you need.
Before You Collect Anything: Operationalization
This is the step that separates researchers who get usable data from those who collect numbers that answer the wrong question entirely.
Operationalization is the process of translating an abstract concept into something measurable. It sounds technical, but the idea is straightforward: before you can measure something, you have to define exactly what “measuring it” means.
Take the concept of customer loyalty. That’s not directly observable. But you can operationalize it as: repeat purchase rate over 12 months, Net Promoter Score, or number of referrals made. Each operationalization produces a different number and tells a slightly different story. Choose the wrong one and your data won’t answer the question you actually care about.
Equally important are levels of measurement, which determine what you can statistically do with your data:
- Nominal — categories with no order (gender, product category, country)
- Ordinal — ranked categories with unequal gaps (satisfaction: poor/fair/good/excellent)
- Interval — equal gaps, no true zero (temperature in Celsius, calendar year)
- Ratio — equal gaps with a true zero (revenue, age, number of items purchased)
The higher the level, the more statistical power you have. Ratio data supports the full range of statistical operations. Nominal data supports frequency counts and chi-square tests. Trying to calculate a mean from nominal data is a common — and costly — mistake.
Always operationalize your variables and confirm their measurement level before you design your data collection instrument.
The 9 Quantitative Data Collection Methods
1. Surveys and Questionnaires
Surveys are the most widely used quantitative data collection method — and the most frequently misused. When designed well, a structured survey with closed-ended questions produces scalable, comparable, statistically analysable data from large samples at relatively low cost.
Quantitative surveys use response formats that produce numbers: Likert scales (strongly agree to strongly disagree, typically 5 or 7 points), rating scales, ranking questions, multiple choice, and yes/no binary items.
One critical quality metric for multi-item scales is Cronbach’s alpha — a measure of internal consistency that tells you whether the items in your scale are all measuring the same underlying construct. A Cronbach’s alpha above 0.7 is generally considered acceptable; below that, your scale may be measuring more than one thing, or measuring nothing coherently.
When to use it: Market research, customer satisfaction measurement, employee engagement studies, large-scale social research, academic studies requiring generalisation to a population.
Real example: A retail bank wanting to measure customer trust across 40,000 account holders used a 12-item validated trust scale delivered via post-transaction email survey. The Cronbach’s alpha of 0.84 confirmed strong internal consistency. Segmented analysis by customer tenure revealed that trust dropped sharply in the first six months — a finding that directly shaped the bank’s new onboarding programme.
Watch out for: Acquiescence bias (respondents agreeing with statements regardless of content), social desirability bias (answering in ways that seem acceptable rather than truthful), and leading questions that push respondents toward a particular answer. Pilot test every survey before full deployment.
2. Structured Interviews
Unlike qualitative interviews that explore and probe, structured interviews in quantitative research ask every respondent the exact same questions in the exact same order, with predetermined response options. The interviewer records answers on a standardised instrument — not interpretations, just selections.
This method combines the reach and consistency of surveys with the engagement and lower non-response rates of human interaction. It’s particularly effective when the population has low digital literacy, when telephone or in-person contact is necessary, or when complex questions require brief clarification.
When to use it: National census and population studies, telephone polling, health surveys with older populations, market research in low-connectivity regions.
Real example: A government health agency measuring hypertension prevalence in rural communities used structured telephone interviews rather than online surveys. The standardised instrument — identical for every interviewer across every region — allowed direct statistical comparison across 14 districts, something a self-administered survey would have made far harder given varying literacy levels in the target population.
Watch out for: Interviewer effect — even in structured formats, subtle vocal cues, pacing, and tone can influence responses. Train interviewers rigorously, use standardised scripts, and monitor inter-rater consistency throughout data collection.
3. Experiments and A/B Testing
Controlled experiments are the gold standard for establishing causality in quantitative research. By manipulating one variable (the independent variable) while controlling all others, and measuring the effect on an outcome (the dependent variable), experiments allow researchers to move beyond correlation and establish cause-and-effect relationships.
In digital research, this typically means A/B testing — randomly assigning users to two or more conditions and measuring which produces better outcomes. In clinical and social science contexts, it means randomised controlled trials (RCTs).
The key principle is random assignment. When participants are randomly allocated to conditions, systematic differences between groups are eliminated, making the experiment internally valid — meaning the observed effect is genuinely caused by the manipulation, not by a confounding variable.
When to use it: Product feature testing, conversion rate optimisation, clinical trials, educational intervention research, policy evaluation, pricing strategy.
Real example: An e-commerce platform testing a new checkout flow used A/B testing across 80,000 sessions. Version B — which reduced the checkout from four steps to two — produced a 23% reduction in cart abandonment at statistical significance (p < 0.01). Critically, the team ran the test for three full weeks rather than stopping at the first promising result, avoiding the peeking problem where early stopping produces false positives.
Watch out for: Underpowered experiments. Running a test with too small a sample produces results that may look meaningful but aren’t statistically reliable. Always calculate the required sample size using a power analysis before you start — not after.
4. Structured Observation
Structured observation collects quantitative data by watching and systematically recording behaviour according to a pre-defined coding scheme. Rather than describing what happens (qualitative), the researcher counts how often specific behaviours occur, how long they last, or in what sequence they appear.
This produces frequency counts, duration measurements, and behavioural rates — all directly usable in statistical analysis.
When to use it: Retail foot traffic analysis, classroom behaviour research, workplace productivity studies, sports performance analytics, usability benchmarking.
Real example: A supermarket chain analysed checkout queue behaviour using structured observation across 20 stores. Observers used a standardised checklist to record queue length at five-minute intervals, average transaction duration, and the number of customers who abandoned queues. The resulting dataset — 14,000 observation records across eight weeks — showed that queues longer than four people at 12:30–1:30pm caused a measurable drop in same-day return visits, quantified through loyalty card data linkage.
Watch out for: Inter-rater reliability — the degree to which different observers record the same behaviours consistently. If two observers watching the same event produce different counts, your data is unreliable. Calculate Cohen’s kappa to quantify inter-rater agreement, and retrain observers if it falls below acceptable thresholds.
5. Secondary Data Analysis
Secondary data analysis uses data collected by someone else for a different purpose and reanalyses it to answer a new research question. Sources include government databases, academic datasets, company transaction records, census data, WHO and World Bank datasets, financial reports, and administrative records.
This method is often underestimated. Large, well-maintained secondary datasets frequently have far larger sample sizes than anything a single researcher could collect independently — and when the original collection methodology was rigorous, the data quality is high.
When to use it: Trend analysis over long time periods, benchmarking against national or industry norms, research contexts where primary data collection would be prohibitively expensive or ethically problematic, meta-analysis.
Real example: A public health researcher studying the long-term relationship between physical activity and cardiovascular outcomes didn’t need to recruit a single participant. By analysing 12 years of data from a nationally representative longitudinal health survey (n = 47,000), they identified dose-response relationships between weekly step counts and hospitalisation rates — at a level of statistical power no primary study could have matched within a realistic timeframe or budget.
Watch out for: The original data was collected for a different purpose, which means it may not perfectly match your research question. Check the original methodology carefully — sample frame, collection period, variable definitions, and missing data patterns — before building your analysis on it.
6. Biometric and Physiological Measurement
Physiological measurement collects quantitative biological data directly from the human body — objectively, continuously, and without relying on self-report. This includes heart rate, galvanic skin response (a measure of emotional arousal), brain activity via EEG, eye-tracking, blood pressure, cortisol levels, and reaction time.
Because the body can’t lie the way survey respondents can, physiological data captures states that people either can’t accurately introspect on or won’t willingly report. It’s particularly powerful for measuring emotional and cognitive responses to stimuli.
When to use it: Neuromarketing and advertising research, UX and product testing, clinical trials, occupational health research, sports science, human factors studies.
Real example: An advertising agency tested three versions of a new TV commercial using galvanic skin response and eye-tracking with a panel of 60 participants. One version consistently produced higher arousal responses during the brand reveal moment — a finding that wasn’t visible in post-exposure survey ratings, where all three versions scored similarly. The physiological data made the decision.
Watch out for: Equipment calibration and environmental conditions significantly affect data quality. Physiological measures also require careful operationalization — galvanic skin response measures arousal, not valence. It can’t tell you whether the person is excited or anxious without supporting data.
7. Web and Digital Analytics
Digital analytics collects quantitative behavioural data from users interacting with websites, apps, and digital products. Every click, scroll, session, conversion, and drop-off generates a data point — automatically, at scale, in real time.
Tools like Google Analytics, Mixpanel, Amplitude, and Adobe Analytics transform these raw behavioural signals into structured datasets: page views, session duration, conversion funnels, feature adoption rates, cohort retention, and more.
When to use it: Product analytics, marketing attribution, conversion optimisation, content performance measurement, app usage analysis, customer journey mapping at scale.
Real example: A SaaS company noticed that free trial conversion rates had dropped 18% quarter-over-quarter without any obvious product change. Web analytics revealed a new bottleneck: users who reached the “invite team member” feature within the first three days converted at 3x the rate of those who didn’t. That single behavioural metric — reaching one specific feature — became the activation benchmark that shaped the entire onboarding redesign.
Watch out for: Digital analytics measures what users do, not why they do it. Data quality depends entirely on correct implementation — misconfigured tracking, missing event tags, or ad blockers can produce significant data gaps. Always validate your analytics setup against actual user sessions before drawing conclusions.
8. Passive Sensor and Wearable Data Collection
This is the fastest-growing category of quantitative data collection — and the one most completely absent from existing guides.
Passive data collection uses sensors, wearables, and connected devices to gather numerical data continuously and automatically, without requiring any active input from the participant. The data is a byproduct of everyday activity: a smartwatch recording heart rate variability, a smartphone accelerometer logging movement patterns, an environmental sensor measuring air quality, a retail footfall counter tracking store traffic.
Unlike traditional self-report methods, passive data collection through wearables captures day-to-day fluctuations and long-term trends without relying on patient recall — yielding a more accurate, holistic picture across diverse environments.
This distinction matters enormously. Self-report data — surveys, interviews — measures what people think they do or remember doing. Passive sensor data measures what they actually do, continuously and objectively.
When to use it: Clinical trials and remote patient monitoring, occupational health and workplace ergonomics research, sports performance analytics, smart city and urban planning research, consumer behaviour in physical retail, agricultural monitoring, environmental research.
Real example: A clinical research organisation running a 12-week depression treatment trial equipped participants with consumer smartwatches that continuously logged sleep duration, sleep quality, step count, and heart rate variability. Rather than relying solely on weekly clinician-administered depression scales, the passive sensor data provided daily objective measures of functional recovery — detecting improvement trends five to seven days before they appeared in self-report scores, allowing the clinical team to identify early responders and adjust protocols accordingly.
Watch out for: Passive collection generates vast data volumes that require robust storage and processing infrastructure. Participant compliance with wearing devices consistently is a real challenge — passive data collection faces data consistency and authorisation issues, and ML techniques can reduce participant burden by optimising prompt timing and minimising prompt frequency. Privacy and informed consent requirements are also stricter for biometric and location data under GDPR and equivalent regulations.
9. Existing Records and Administrative Data
Administrative data is collected as a by-product of running an organisation or system — not for research purposes, but for operational ones. School attendance records, hospital admissions databases, financial transaction logs, tax records, insurance claims, and social welfare records are all examples.
When accessed with appropriate permissions and ethical oversight, administrative datasets offer extraordinary scale and longitudinal depth. Some datasets span decades and millions of individuals — far beyond what any primary study could achieve.
When to use it: Public health epidemiology, educational attainment research, economic analysis, crime and criminal justice research, social policy evaluation, organisational HR analytics.
Real example: Researchers studying the long-term employment outcomes of a job training programme didn’t survey graduates — they linked programme attendance records to national tax and employment databases with full ethical approval. The linked administrative dataset showed that programme graduates earned, on average, 14% more over the five years following completion compared to matched non-participants — a finding with far more statistical power than any survey-based follow-up could have produced.
Watch out for: Access and ethics. Administrative data almost always contains personal information, and accessing it requires formal data sharing agreements, ethical approval, and rigorous data security protocols. Data definitions also change over time — what “employed” or “hospitalised” means in one decade’s records may differ from another.
Validity and Reliability: The Two Non-Negotiables
Every quantitative data collection method must be evaluated against two fundamental quality standards. Skip either one and your numbers are, at best, interesting — not credible.
Reliability is consistency. A reliable measurement produces the same result when applied to the same phenomenon under the same conditions. A bathroom scale that shows 70kg one moment and 74kg the next — without the person moving — is unreliable. In research, you assess reliability through test-retest correlation, split-half reliability, or Cronbach’s alpha for multi-item scales.
Validity is accuracy. A valid measurement actually measures what it claims to measure. There are several forms:
- Construct validity — does your measure actually capture the underlying concept? (Does your “customer loyalty” scale really measure loyalty, or does it measure satisfaction — a related but different thing?)
- Internal validity — in experimental research, are observed effects actually caused by your manipulation, or by a confounding variable?
- External validity — can your findings be generalised beyond your sample and setting?
- Content validity — does your instrument cover the full range of the concept, or just part of it?
A measurement can be reliable without being valid. A thermometer that consistently reads 2°C too high is highly reliable — and completely invalid. In quantitative research, you need both.
Sampling: The Decision That Shapes Everything
No quantitative study collects data from an entire population. You collect from a sample and draw conclusions about the wider group. How you build that sample determines whether your findings are generalisable — or meaningless.
Probability sampling methods give every member of the target population a known, non-zero chance of selection. This is what makes statistical generalisation legitimate:
- Simple random sampling — every individual has an equal chance of selection
- Stratified sampling — the population is divided into subgroups (strata) and sampled proportionally
- Cluster sampling — naturally occurring groups are randomly selected, then all members within selected clusters are studied
- Systematic sampling — every nth member of a population is selected
Non-probability sampling methods don’t guarantee representativeness. Convenience samples, snowball samples, and purposive samples are faster and cheaper — but findings can’t be statistically generalised to the broader population. Know which you’re using and be transparent about what that means for your conclusions.
Statistical power and sample size are where many researchers quietly go wrong. A study with too small a sample has insufficient power to detect real effects — it will miss genuine differences and produce false negatives. Always run a power analysis before data collection to determine the minimum sample size your study needs, given the effect size you’re trying to detect and the significance threshold you’re working to.
Avoiding Measurement Error
Measurement error is the gap between what you measure and the true value of what you’re trying to measure. It exists in every quantitative study. Managing it is the difference between data you can act on and data that misleads you.
Two types matter:
Systematic error (bias) shifts measurements consistently in one direction. A poorly worded survey question that leads respondents toward “agree” creates systematic error. So does a scale that’s poorly calibrated. Systematic error doesn’t average out — it distorts every data point in the same direction, and no amount of sample size increase will fix it. Only better instrument design will.
Random error is unpredictable variation — noise in the measurement process. Some respondents misread a question; some sensor readings fluctuate due to environmental interference. Random error can be reduced by increasing sample size, using more precise instruments, and standardising data collection conditions.
The most common sources of measurement error in practice:
- Poorly operationalized variables — measuring a proxy for the concept rather than the concept itself
- Ambiguous question wording — respondents interpret the same question differently
- Social desirability bias — respondents answer how they think they should, not how they actually feel
- Order effects — the sequence of questions in a survey influences how respondents answer later items
- Instrument drift — measurement tools lose calibration accuracy over time in longitudinal studies
The single most effective protection against measurement error is a thorough pilot test — running your full data collection procedure with a small sample before the main study, examining the results, and refining anything that looks problematic.
The Ethics and GDPR Layer
Quantitative data collection is not exempt from ethical obligations simply because it deals in numbers rather than personal narratives.
Informed consent is required regardless of method. Participants in surveys, experiments, and observational studies all have the right to know what data is being collected, how it will be used, and how long it will be stored.
Anonymisation and data minimisation matter. Collect only what your research question requires. Large datasets — especially those combining demographic variables — can re-identify individuals even when names are removed.
GDPR applies fully to any quantitative data collection involving individuals in the EU or UK. Passive sensor data, biometric measurements, and administrative records linked to identifiable individuals all carry stricter requirements. Biometric data is classified as special category data under GDPR and requires explicit consent and a documented lawful basis.
Secondary data use requires checking the original consent terms. Data collected under one purpose cannot automatically be repurposed for a different research question without re-evaluation of the consent framework.
How to Choose the Right Quantitative Method
Five questions will narrow your choice quickly:
1. Are you trying to describe, compare, or establish causality? Description → surveys, digital analytics, secondary data. Comparison across groups → structured observation, experiments. Causation → controlled experiments, RCTs.
2. How large does your sample need to be? Run a power analysis. If you need tens of thousands of data points, passive sensors, digital analytics, or secondary data will serve you better than individually administered surveys.
3. Can participants accurately self-report what you need to know? If the behaviour is unconscious, hard to recall, or subject to social desirability bias — use observation, physiological measurement, or passive sensor data instead of self-report.
4. What is your timeframe? Cross-sectional studies capture a moment in time. Longitudinal designs track change. Passive sensor and administrative data are particularly powerful for longitudinal research.
5. What are your ethical constraints? Some methods require more intensive consent processes, ethical approval, or data security infrastructure than others. Factor this into your planning from the start — not as an afterthought.
| Research Goal | Best Method(s) |
|---|---|
| Measure attitudes or opinions at scale | Surveys and Questionnaires |
| Test causal relationships | Experiments / A/B Testing |
| Track real-world behaviour objectively | Structured Observation, Passive Sensors |
| Measure physiological/emotional response | Biometric Measurement |
| Analyse historical trends at population scale | Secondary Data, Administrative Records |
| Monitor digital behaviour continuously | Web and Digital Analytics |
| Collect consistent data across large geographic areas | Structured Interviews |
Common Mistakes to Avoid
Even experienced researchers make these errors with costly consequences:
- Skipping the power analysis. Collecting data and then discovering your sample was too small to detect the effect is one of the most avoidable failures in quantitative research.
- Confusing correlation with causation. Surveys and observational data show associations. Only well-designed experiments establish cause-and-effect.
- Over-generalising from a convenience sample. “Our survey of 200 university students” does not generalise to “people in general.” Be explicit about what your sample actually represents.
- Ignoring missing data. Missing values are rarely random. How you handle them — deletion, imputation, or sensitivity analysis — significantly affects your results. Never ignore them.
- Stopping an A/B test too early. Peeking at results before reaching the pre-specified sample size dramatically inflates false positive rates. Commit to the sample size your power analysis specified.
- Treating ordinal data as interval data. A 5-point Likert item is ordinal — the gap between “agree” and “strongly agree” is not guaranteed to equal the gap between “neutral” and “agree.” Applying means and standard deviations to ordinal data is a common and consequential error.
Final Thoughts
Quantitative data collection is not just about gathering numbers. It’s about gathering numbers that are reliable, valid, ethically obtained, and correctly interpreted.
The method you choose shapes what questions you can answer, what statistical tests are legitimate, and how far your findings can travel beyond your sample. Choose carelessly and you end up with impressive-looking data that answers the wrong question — or the right question with the wrong instrument.
Start with a clear research question. Operationalize your variables with precision. Match your method to your design. Build reliability and validity in from the start. And always — always — pilot test before you commit to full data collection.
Numbers have authority. Make sure yours have earned it.
This article is part of a topical cluster on data collection methods. For a complete overview of all methods — quantitative, qualitative, and emerging — see our guide: [15 Data Collection Methods Explained (With How to Choose the Right One)]. For the qualitative counterpart to this article, see: [Qualitative Data Collection Methods: 10 Techniques, Real Examples & When to Use Each.]